Thread 'GPU usage utility available?'
Message boards : GPUs : GPU usage utility available?
Message board moderation
| Author | Message |
|---|---|
|
Send message Joined: 9 Mar 19 Posts: 7 
|
Is there a way to tell or utility that shows witch GPU is being used and to what degree? I recently upgraded from one to two GPUs, but I can detect no performance increase. (FYI) running Windows 10, on an MSI GT83VR 2xGTX 1070s, 64GB Ram. ID: 91695 · |
 Joseph Stateson Joseph StatesonSend message Joined: 27 Jun 08 Posts: 642
|
GPU-z from Tech Power Up is a good choice. I once found that when I added a 2nd RX-570 AMD driver on its own saw fit to enabled cross-fire and that second GPU was never used. I had to disable cross-fire. As I recall BOINC assigned a task to it but it never finished and GPU-z showed it had no load. If you are a game player and use SLI you may have to juggle enable / disable SLI. That is just a guess. Perhaps the AMD drivers as unable to work with boinc in crossfire mode and the nvidia might in SLI. GPUz will tell you in any event. https://www.techpowerup.com/gpuz/ ID: 91696 · |
|
Send message Joined: 5 Oct 06 Posts: 5150 
|
Actually, the Windows 10 Task Manager has quite a good GPU usage monitor, but you have to dig a bit to find it. The GPUs are listed on the 'Performance' tab, but when you first open it the four mini-graphs all show nothing happening: they refer mostly to video processing activity, which isn't relevant for Distributed Computing. Each graph has a 'picker' - drop-down list at top left - which can display different values. I think the names are different for each manufacturer's products, and I don't have an active W10 GPU to check with, but if you search through the 10 or so possibilities, you should find a useful display. ID: 91700 · |
|
Send message Joined: 9 Mar 19 Posts: 7
|
Thank you for your reply. For the record, I'm not a gamer and bought this 'dual GPU' computer to do more Seti crunching. It appears that neither GPU 1070's are being used in Boinc. Early on, I tried to re-install Boinc but no help. Do you have any other advice or suggestion(s)? ID: 91722 · |
|
Send message Joined: 5 Oct 06 Posts: 5150
|
How do you know that the GPUs aren't being used? What exactly are you seeing, or not seeing, that tells you "no go"? The most useful information to give potential helpers is the first 30 lines or so of the Event Log, after a fresh system restart. A lot to get our collective teeth into in there. ID: 91723 · |
|
Send message Joined: 9 Mar 19 Posts: 7
|
Thanks for the suggestion to use GPU-Z. Here are a few screen grabs of it showing the first two screens for each GPU: [url]https://www.use.com/OiCSA [/url] (Hope the image link works, never done this B4) https://www.use.com/OiCSA Am I correct that neither GPU is being used? ID: 91725 · |
|
Joseph Stateson Send message Joined: 27 Jun 08 Posts: 642
|
Nope, not working. sensor shows no load and freq is too low. Boinc Manager should show something like the following 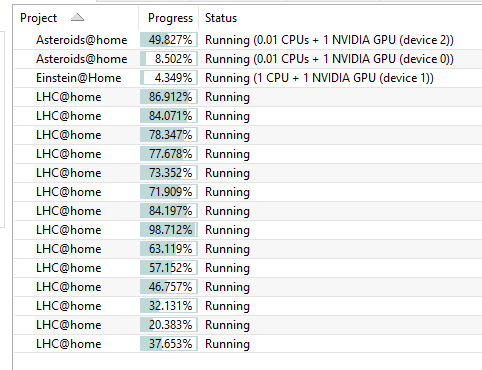 What project are you attached to? I can look a the project and see if anything is out of the ordinary Also, look in your event log for a message like the following - 6 6/4/2019 4:59:15 PM CUDA: NVIDIA GPU 0: GeForce GTX 1070 (driver version 430.86, CUDA version 10.2, compute capability 6.1, 4096MB, 3556MB available, 6852 GFLOPS peak) 7 6/4/2019 4:59:15 PM CUDA: NVIDIA GPU 1: GeForce GTX 1070 (driver version 430.86, CUDA version 10.2, compute capability 6.1, 4096MB, 3556MB available, 6463 GFLOPS peak) 8 6/4/2019 4:59:15 PM OpenCL: NVIDIA GPU 0: GeForce GTX 1070 (driver version 430.86, device version OpenCL 1.2 CUDA, 8192MB, 3556MB available, 6852 GFLOPS peak) 9 6/4/2019 4:59:15 PM OpenCL: NVIDIA GPU 1: GeForce GTX 1070 (driver version 430.86, device version OpenCL 1.2 CUDA, 8192MB, 3556MB available, 6463 GFLOPS peak) 10 6/4/2019 4:59:15 PM Host name: jysHPZ400 11 6/4/2019 4:59:15 PM Processor: 12 GenuineIntel Intel(R) Xeon(R) CPU X5680 @ 3.33GHz [Family 6 Model 44 Stepping 2] 12 6/4/2019 4:59:15 PM Processor features: fpu vme de pse tsc msr pae mce cx8 apic sep mtrr pge mca cmov pat pse36 clflush dts acpi mmx fxsr sse sse2 ss htt tm pni ssse3 cx16 sse4_1 sse4_2 popcnt aes syscall nx lm vmx smx tm2 dca pbe ID: 91727 · |
|
Send message Joined: 5 Oct 06 Posts: 5150
|
Also, look in your event log for a message like the followingPlease post the whole of the first 30 lines, not just selected highlights. You might leave out the parts that seem unimportant you, but are meaningful to us. ID: 91729 · |
|
Send message Joined: 9 Mar 19 Posts: 7
|
The following is the event log. When I start the program, the task name at the top shows a red 'stop sign' and the program is halted showing the 'computer in use' message. Then I manually select a lower 'green arrow' task "SETI@home v8", and the program runs again. The event log doesn't show that this happened though. Here it is: 6/5/2019 4:12:47 PM | | Starting BOINC client version 7.14.2 for windows_x86_64 6/5/2019 4:12:47 PM | | log flags: file_xfer, sched_ops, task 6/5/2019 4:12:47 PM | | Libraries: libcurl/7.47.1 OpenSSL/1.0.2g zlib/1.2.8 6/5/2019 4:12:47 PM | | Data directory: C:\ProgramData\BOINC 6/5/2019 4:12:47 PM | | Running under account new 6/5/2019 4:12:48 PM | | CUDA: NVIDIA GPU 0: GeForce GTX 1070 (driver version 430.86, CUDA version 10.2, compute capability 6.1, 4096MB, 3556MB available, 6738 GFLOPS peak) 6/5/2019 4:12:48 PM | | CUDA: NVIDIA GPU 1: GeForce GTX 1070 (driver version 430.86, CUDA version 10.2, compute capability 6.1, 4096MB, 3556MB available, 6738 GFLOPS peak) 6/5/2019 4:12:48 PM | | OpenCL: NVIDIA GPU 0: GeForce GTX 1070 (driver version 430.86, device version OpenCL 1.2 CUDA, 8192MB, 3556MB available, 6738 GFLOPS peak) 6/5/2019 4:12:48 PM | | OpenCL: NVIDIA GPU 1: GeForce GTX 1070 (driver version 430.86, device version OpenCL 1.2 CUDA, 8192MB, 3556MB available, 6738 GFLOPS peak) 6/5/2019 4:12:48 PM | | Host name: DESKTOP-3K6UI2V 6/5/2019 4:12:48 PM | | Processor: 8 GenuineIntel Intel(R) Core(TM) i7-6820HK CPU @ 2.70GHz [Family 6 Model 94 Stepping 3] 6/5/2019 4:12:48 PM | | Processor features: fpu vme de pse tsc msr pae mce cx8 apic sep mtrr pge mca cmov pat pse36 clflush dts acpi mmx fxsr sse sse2 ss htt tm pni ssse3 fma cx16 sse4_1 sse4_2 movebe popcnt aes f16c rdrandsyscall nx lm avx avx2 vmx tm2 pbe fsgsbase bmi1 hle smep bmi2 6/5/2019 4:12:48 PM | | OS: Microsoft Windows 10: x64 Edition, (10.00.17134.00) 6/5/2019 4:12:48 PM | | Memory: 63.96 GB physical, 73.46 GB virtual 6/5/2019 4:12:48 PM | | Disk: 476.34 GB total, 379.50 GB free 6/5/2019 4:12:48 PM | | Local time is UTC -5 hours 6/5/2019 4:12:48 PM | | No WSL found. 6/5/2019 4:12:48 PM | | VirtualBox version: 5.2.8 6/5/2019 4:12:48 PM | | Config: use all coprocessors 6/5/2019 4:12:48 PM | SETI@home | URL http://setiathome.berkeley.edu/; Computer ID 8710401; resource share 100 6/5/2019 4:12:48 PM | | No general preferences found - using defaults 6/5/2019 4:12:48 PM | | Reading preferences override file 6/5/2019 4:12:48 PM | | Preferences: 6/5/2019 4:12:48 PM | | max memory usage when active: 32746.73 MB 6/5/2019 4:12:48 PM | | max memory usage when idle: 58944.11 MB 6/5/2019 4:12:48 PM | | max disk usage: 379.60 GB 6/5/2019 4:12:48 PM | | don't use GPU while active 6/5/2019 4:12:48 PM | | suspend work if non-BOINC CPU load exceeds 25% 6/5/2019 4:12:48 PM | | (to change preferences, visit a project web site or select Preferences in the Manager) 6/5/2019 4:12:48 PM | | Setting up project and slot directories 6/5/2019 4:12:48 PM | | Checking active tasks 6/5/2019 4:12:48 PM | | Setting up GUI RPC socket 6/5/2019 4:12:48 PM | | Checking presence of 226 project files 6/5/2019 4:12:48 PM | | Suspending GPU computation - computer is in use ID: 91732 · |
|
Send message Joined: 5 Oct 06 Posts: 5150
|
Thanks - that helps. We can look at Valid tasks for computer 8710401 and see that your GPU is, in fact, returning valid work - most recently at 5 Jun 2019, 20:49:10 UTC (less than an hour ago). It is possible that your machine is working fine when you're not looking at it, but switching itself off (for SETI, at least) when you look at it, simply because it thinks you want to do something more important with it. Your description of 'stop signs' and green arrows confirms that you are using the 'Simple View' of the BOINC Manager program: if you are interested and want to get more involved involved in the SETI project, you can switch to the 'Advanced View' and find more information about what's going on and how you can manage it. But that's not important: you're fine as you are. ID: 91733 · |
|
Send message Joined: 9 Mar 19 Posts: 7
|
This is a screen grab of the image. It goes on for about another page but it's pretty much the same... <center><img src="https://www.use.com/images/s_4/17f40f5fef6c8736c3b0.jpg"></center> -or- https://www.use.com/OiCSv ID: 91734 · |
|
Send message Joined: 5 Oct 06 Posts: 5150
|
 (this message board uses BBcode, rather than HTML, and PNG format preserves sharp detail better than JPG) ID: 91735 · |
|
Send message Joined: 9 Mar 19 Posts: 7
|
Solved!! On a whim, I was trying physical settings on this laptop, and was playing with the fan speeds. Although the computer is now howling like a Pratt & Whitney J58, it did start the GPUs up. This MSI laptop was just looking out for itself. Kinda cool. Thanks for your efforts, and had you not made the suggestion(s), I wouldn't have been trying different things to get Boinc crunching... ID: 91736 · |
Copyright © 2025 University of California.
Permission is granted to copy, distribute and/or modify this document
under the terms of the GNU Free Documentation License,
Version 1.2 or any later version published by the Free Software Foundation.